We could find some ratest report of US drink driving report in 2022 which put on NHTSA web-site for these 4 month.
These reports shows us details of drunk driving in USA.
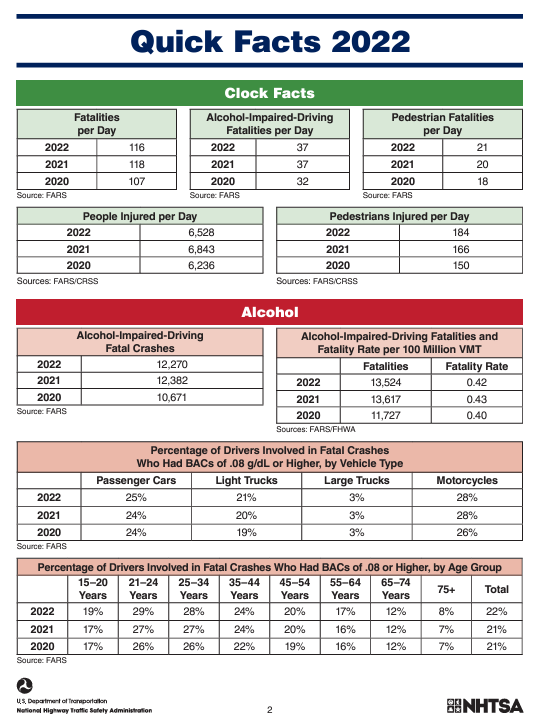
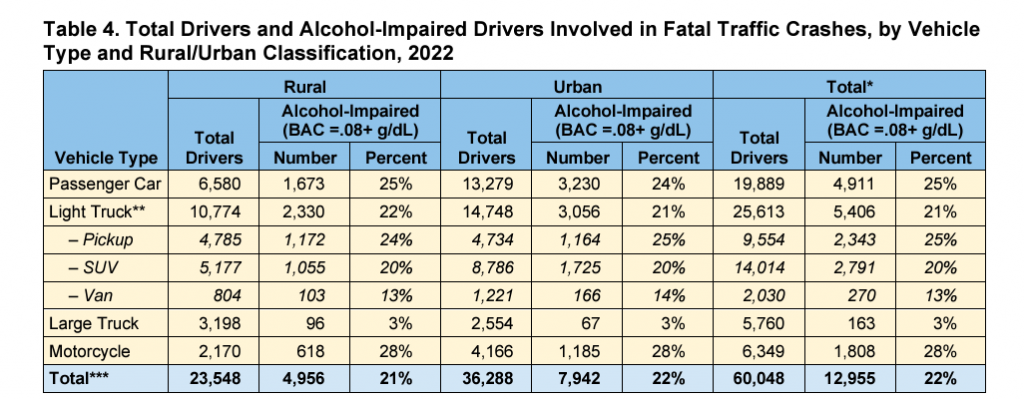
Details means that ,for example, when we look to ” per vehicle” , we see Large trucks fatal crashes has 3% every year and keep same status.
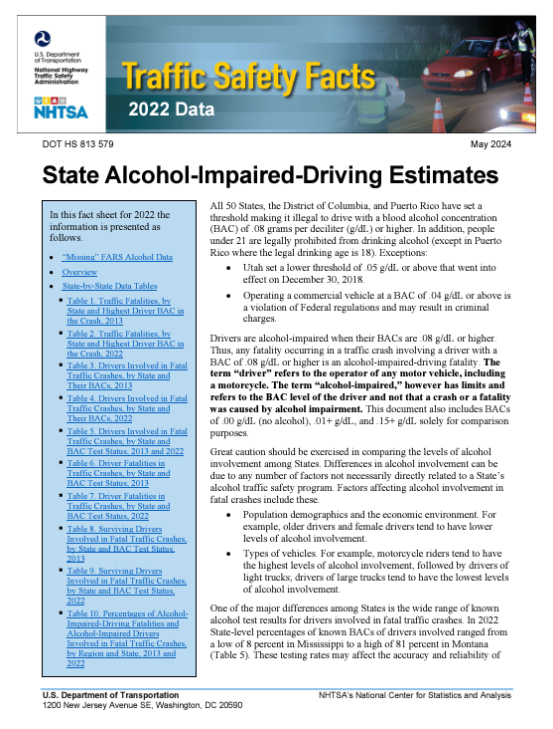
NHTSA also reported “by state” alcohol related crashes.
Texas and California are mostly worst 1or2 for this 10 years .
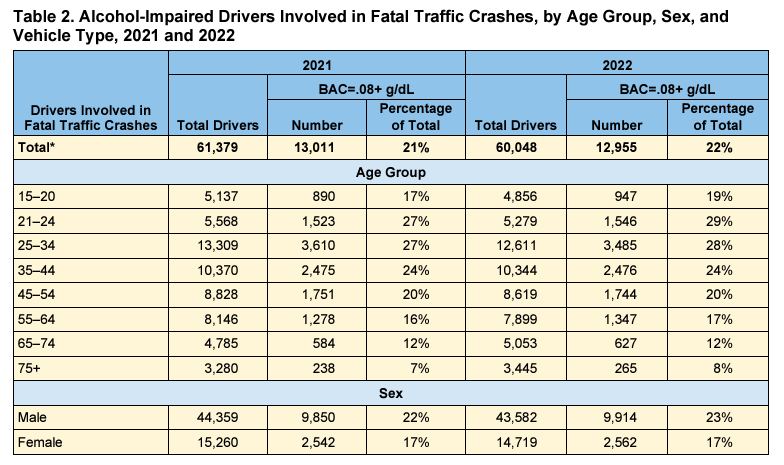
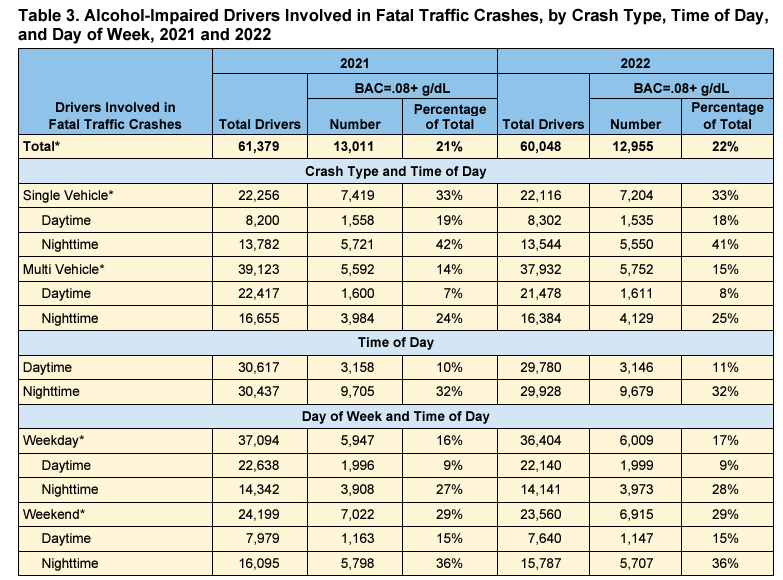
More specific data are shown in report. Day time or night time? which generations are most signigicant?
We can find such detail data …..
Rural/Urban Traffic Fatalities
This is a report which view of ” Urban , rural”.
We can know Drunk driver are in rural are or urban are.
All references are from below
-

2026.1.11
-

2025.12.11
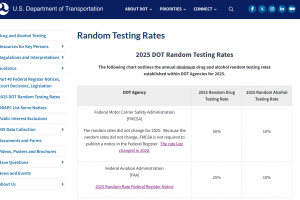
Trump administration’s campaign for CDL standard. What is a “Professional driver”?
-
2025.1.31
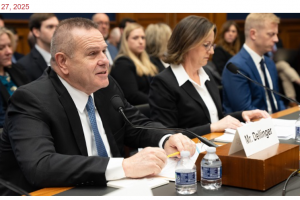
ATA Chairman spoke out on Congress about Issues involved ratest Trucking industry
-
2025.1.10