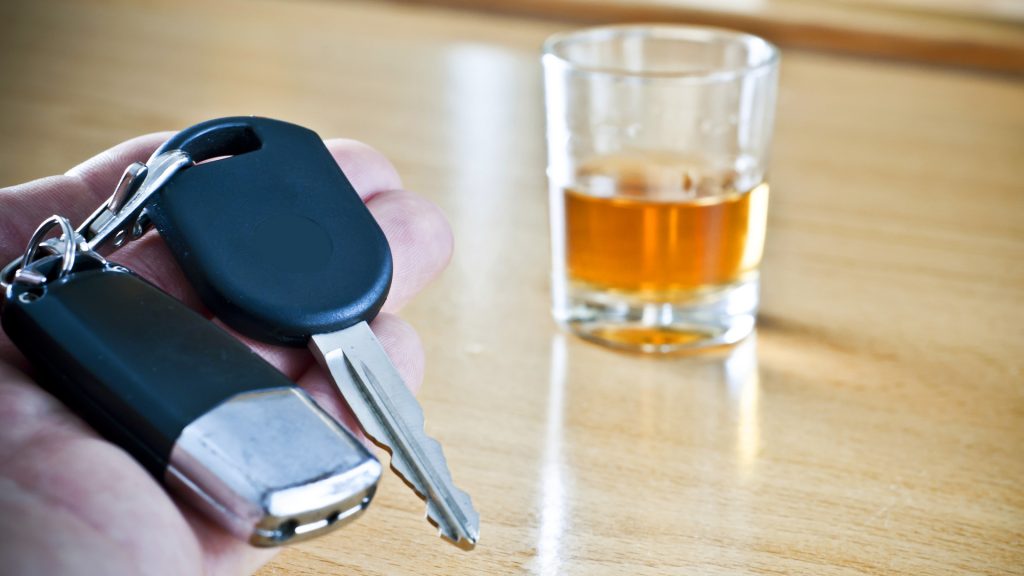
アメリカは、間違いなく、アルコールインターロック装着数No1の国です。現在、全50州、何らかのかたちのアルコールインターロック法が施行されています。それだけ、飲酒運転が多いということでもあります。

アメリカのAIIPA(Association of Ignition Interlock Program Administrators 全米アルコールインターロック管理者協会)および TIRF Canada(自動車事故研究機構 本部カナダ)とパートナーシップを結んでいるTIRF USATIRF USA incは、2020年9月14日、2018年度米国全州アルコールインターロック装置の装着数の調査結果を公表しました。

エグゼクティブサマリーより
As of December 2019, 35 states and Washington, D.C. required all alcohol-impaired driving offenders, including first offenders, to install an interlock device. There was a 3.6% decrease in alcohol-impaired driving fatalities in 2018 from 2017 (National Center for Statistics and Analysis 2019).
As of March 1st, 2020, data were received from 25 states and Washington, D.C. Three measures were used in this study to measure trends in interlock installations:
● Total Installs Number (TIN): Total number of newly installed interlocks between January 1st through to December 31st in a given year.
● Total Installs Number all (TIN all): Total number of interlocks installed in vehicles at any time between January 1st through to December 31st in a given year, including devices installed prior to January 1st but that were still in the vehicle for any period of time during that year following January 1st.
●Active Installs Number (AIN): Total number of interlocks in vehicles of active participants on December 31st of a given year.
There were 145,202 new ignition interlock devices (TIN) installed in 18 states and Washington, D.C. in 2018. When comparing new interlock installations among the 12 states who provided TIN data for both 2016 and 2018 there was a 20% increase in installations from 65,967 in 2016 to 79,013 in 2018. Since 2014 there has been a 34% increase in TIN according to data available from six states.
Based on TIN all data, 223,223 installations were reported in 17 states and Washington, D.C. in 2018. When comparing total installations among the 12 states who provided TIN all data for both 2016 and 2018 there was a 10% increase from 143,471 in 2016 to 158,283 in 2018.
Previous data on TIN all collected from manufacturers showed the number of installations nationally was 614,626 in 2016 (Robertson et al., 2018). Applying the 10% growth rate to this number results in an estimated 676,089 total installations nationally in 2018.As of December 31st, 2018, there were 141,480 active installations (AIN) reported in 16 states. When comparing active installations among the 10 states who provided AIN data for both 2016 and 2018 there was a 5% decrease from 110,159 in 2016 to 105,080 in 2018.
However, when comparing data from six states that provided this information since 2014, there has been a 10% increase in AIN.
Among states where data were obtained, the percent of installations (TIN) per Driving while Intoxicated or Impaired (DWI) arrests in 2018 was 48.41%, per 2018 DWI convictions it was 56.73% and per 2018 incoming DWI cases it was 37.57%. While the indicators for DWI arrests and DWI convictions have consistently increased over time (17.5% and 35.3% in 2014; no historical data were available for incoming DWI cases) , ultimately these data revealed considerable room for growth in interlock installation rates within the US.
In conclusion, the preponderance of the evidence shows considerable growth in the industry yet confirms a relatively low installation rate among all eligible offenders
重要な点を2点、ピックアップするならば、
- 2018年、アルコールインターロック新規装着車両は14万5千202台であった。
- 2018年の飲酒運転検挙者数に対して、装着率は48.1%であった。
であると考えます。
装着数の伸びに対して、必要な飲酒運転者への装着率の低さが課題とされているようです。つまり、装着率をあげることで、まだまだ飲酒運転抑止力を高めることができるということかと思います。
-
2026.1.20
-
2026.1.19
飲酒運転防止インストラクターによる飲酒教育セミナー どなたでも参加OK!乾杯の向こうに潜む危険!新年度前に学ぶ、飲酒運転撲滅の切り札 2月4日(水)
-
2026.1.12
韓国のアルコールインターロック法(改正道路交通法50条の3,80条の2、148条の3)、2026年10月からアルコールインターロック限定免許制度開始。
-
2026.1.11


